
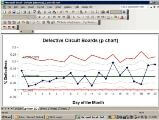
CONTROL CHARTS
– supports advanced control chart features to include how out-of-control checking is performed and enables the addition of data to an existing Control chart.
- Xbar R Chart
- XbarS Chart
- IMR (individuals Moving Range) Chart
- p Chart
- c Chart
- np Chart
- u Chart
ANALYSIS DIAGRAMS
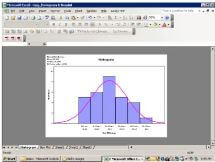
- -Histograms
- -Cpk Analysis
- -Scatter Plot
- -Pareto
- -Box Plots
ANALYSIS TOOLS
- Multiple Regression
- Correlation Matrix
- t Test Matrix
- F Test Matrix
- Independence Test Matrix
- Test of Proportions
- 1 way ANOVA
- Sample Size Estimates
-
- Normal
- Binomial
-
- Confidence Intervals
- Normal
- Standard Deviation
- Cp/Cpk
- Poisson
- Binomial
- Exact Small p
DISTRIBUTIONS
Continuous Distributions
|
Discrete Distributions
|
RANDOM NUMBERS
-SPC XL will generate random numbers from these
distributions:
- Normal
- Uniform Continuous
- Uniform Discrete
- Exponential
- Weibul
 MEASUREMENT SYSTEM ANALYSIS – the XbarR and ANOVA analysis methods in SPC XL are compliant with Measurement System Analysis standard.
- MSA Template for easy data entry
- XbarR Analysis Method
- ANOVA Analysis Method
- Attribute Analysis Method
- Graphs Included with XbarR and ANOVA Analysis
- Operator by Part
- Sigma Product vs Sigma Total
- Misclassification Due to Measurement System Error
- Measurement Pareto
- XbarR Chart color coded by Operator
PROBLEM ID TOOLS
- Display Flowcharting Toolbar. (See Note.)
- PF/CE/CNX/SOP Diagrams and Templates
Note: limited capability which captures Excel’sbuilt-in flowcharting capability.
QUALITY TOOLS
- Run Chart
- Cumulative Sum (CUSUM) Chart
- Product Capability Report
- Failure Mode and Effect Analysis (FMEA)
- Xbar